Thinkful Capstone 1
In this capstone, I provided a complete research report using the framework introduced in the first half of my course. The report tells the story to my intended audience and should include compelling visualizations and actionable insights. I walk through the analysis using clean, reproducible code, and include plenty of notes and comments to guide others through my thinking.
My research question is, “On average, do the daily bicycle rentals decrease when the daily average temperature is 50 degrees or lower, given the sample dataset of 2018?”. Given this research question we can easily test the null hypothesis using a t-test. This t-test will allow us to either accept or reject the null hypothesis to help us answer our research question.
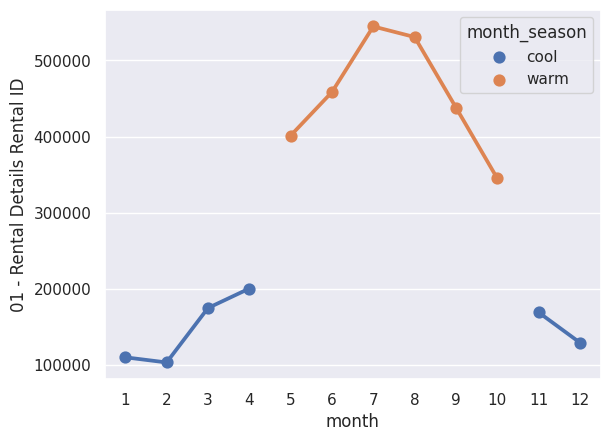
I plan to test the null hypothesis using the dataset provided by splitting the dataset into two smaller datasets. One dataset will be the “warm” months, May to October, and the other dataset will be the “cool”months, November to April. By identifying the warmer months of the year and splitting the dataset in two, we can determine if the daily average bicycle rentals stay the same or are different.
This information can assist our strategy and marketing partners in determining pricing and marketing during the slower months. Pricing is elastic and as such we need to be prepared to offer lower prices during times that demand is lower. We can also create targeted marketing for those that live in and commute around Chicago to help drive demand during the slower times of the year to help lift demand.
#Importing modules
import zipfile
import requests
import io
import pandas as pd
import numpy as np
import seaborn as sns
from scipy import stats
#Grabbing zip folder and extracting files
PATH = 'https://divvy-tripdata.s3.amazonaws.com/Divvy_Trips_2018_Q1.zip'
request = requests.get(PATH)
zip = zipfile.ZipFile(io.BytesIO(request.content))
zip.extractall("/content/Divvy")

PATH = 'https://divvy-tripdata.s3.amazonaws.com/Divvy_Trips_2018_Q2.zip'
request = requests.get(PATH)
zip = zipfile.ZipFile(io.BytesIO(request.content))
zip.extractall("/content/Divvy")

PATH = 'https://divvy-tripdata.s3.amazonaws.com/Divvy_Trips_2018_Q3.zip'
request = requests.get(PATH)
zip = zipfile.ZipFile(io.BytesIO(request.content))
zip.extractall("/content/Divvy")

PATH = 'https://divvy-tripdata.s3.amazonaws.com/Divvy_Trips_2018_Q4.zip'
request = requests.get(PATH)
zip = zipfile.ZipFile(io.BytesIO(request.content))
zip.extractall("/content/Divvy")
#Formatting csv files to be the same
Divvy_2018_Q1 = pd.read_csv('/content/Divvy/Divvy_Trips_2018_Q1.csv')
Divvy_2018_Q2 = pd.read_csv('/content/Divvy/Divvy_Trips_2018_Q2.csv').rename(columns={"trip_id":"01 - Rental Details Rental ID",
                                                                                      "start_time":"01 - Rental Details Local Start Time",
                                                                                      "end_time":"01 - Rental Details Local End Time",
                                                                                      "bikeid":"01 - Rental Details Bike ID",
                                                                                      "tripduration":"01 - Rental Details Duration In Seconds Uncapped",
                                                                                      "from_station_id":"03 - Rental Start Station ID",
                                                                                      "from_station_name":"03 - Rental Start Station Name",
                                                                                      "to_station_id":"02 - Rental End Station ID",
                                                                                      "to_station_name":"02 - Rental End Station Name",
                                                                                      "usertype":"User Type",
                                                                                      "gender":"Member Gender",
                                                                                      "birthyear":"05 - Member Details Member Birthday Year",})
Divvy_2018_Q3 = pd.read_csv('/content/Divvy/Divvy_Trips_2018_Q3.csv').rename(columns={"trip_id":"01 - Rental Details Rental ID",
                                                                                      "start_time":"01 - Rental Details Local Start Time",
                                                                                      "end_time":"01 - Rental Details Local End Time",
                                                                                      "bikeid":"01 - Rental Details Bike ID",
                                                                                      "tripduration":"01 - Rental Details Duration In Seconds Uncapped",
                                                                                      "from_station_id":"03 - Rental Start Station ID",
                                                                                      "from_station_name":"03 - Rental Start Station Name",
                                                                                      "to_station_id":"02 - Rental End Station ID",
                                                                                      "to_station_name":"02 - Rental End Station Name",
                                                                                      "usertype":"User Type",
                                                                                      "gender":"Member Gender",
                                                                                      "birthyear":"05 - Member Details Member Birthday Year",})
Divvy_2018_Q4 = pd.read_csv('/content/Divvy/Divvy_Trips_2018_Q4.csv').rename(columns={"trip_id":"01 - Rental Details Rental ID",
                                                                                      "start_time":"01 - Rental Details Local Start Time",
                                                                                      "end_time":"01 - Rental Details Local End Time",
                                                                                      "bikeid":"01 - Rental Details Bike ID",
                                                                                      "tripduration":"01 - Rental Details Duration In Seconds Uncapped",
                                                                                      "from_station_id":"03 - Rental Start Station ID",
                                                                                      "from_station_name":"03 - Rental Start Station Name",
                                                                                      "to_station_id":"02 - Rental End Station ID",
                                                                                      "to_station_name":"02 - Rental End Station Name",
                                                                                      "usertype":"User Type",
                                                                                      "gender":"Member Gender",
                                                                                      "birthyear":"05 - Member Details Member Birthday Year",})
#Creating one dataframe and manipulating columns
frames = [Divvy_2018_Q1, Divvy_2018_Q2, Divvy_2018_Q3, Divvy_2018_Q4]
Divvy_2018_All = pd.concat(frames)
Divvy_2018_All['month'] = pd.DatetimeIndex(Divvy_2018_All['01 - Rental Details Local Start Time']).month
Divvy_2018_All_Month_Count = Divvy_2018_All[['01 - Rental Details Rental ID','month']].groupby(['month']).count()
# Adding additional column to identify warm/cool months
Divvy_2018_All_Month_Count = Divvy_2018_All_Month_Count.reset_index()

months = Divvy_2018_All_Month_Count['month']

conditions = [
    (months > 4) & (months < 11),
    (months < 5) | (months > 10)
]

choices = [
    "warm",
    "cool"
]

Divvy_2018_All_Month_Count['month_season'] = np.select(conditions, choices)
# Plotting the number of trips per month and color coding the warm/cool months
sns.pointplot(x="month", y="01 - Rental Details Rental ID",
             hue="month_season",
             data=Divvy_2018_All_Month_Count)

#Creating separate dataframes and conducting t-testing
Divvy_2018_All_Month_Count_Warm = Divvy_2018_All_Month_Count[(Divvy_2018_All_Month_Count['month_season'] == "warm")]
Divvy_2018_All_Month_Count_Cool = Divvy_2018_All_Month_Count[(Divvy_2018_All_Month_Count['month_season'] == "cool")]
stats.ttest_ind(Divvy_2018_All_Month_Count_Warm['01 - Rental Details Rental ID'], Divvy_2018_All_Month_Count_Cool['01 - Rental Details Rental ID'])

TtestResult(statistic=8.725720146257473, pvalue=5.460957721304274e-06, df=10.0)
To summarize, we have extracted data from Divvy, transformated the data based on our requirements set forth in the research proposal, and loaded the data to a visual chart and t-test stats. From the chart alone we can easily determine that the warmer months do indeed have a higher volume of trips than the cooler months. But we can take it one step further and look at pvalues and t-stats.
We know that p-values under 0.005 are significant and we have a p-value well below that. We also have a high t-statistic. From both of these we can confidently reject the null hypothesis. There is a statistically significant difference between the two population sets.
Ending with this information we know that we should provide this to our strategy and marketing partners to help them with pricing and marketing during the slower months. In this way we can try to drive up demand in the slower months when less bikes are being used.